VAISHALI CHAWLA
-Based in Delhi, India
I help investors & strategy teams move from raw information to real decisions.
Sometimes that means structured research and clean models.
Other times it means making sense of incomplete data and understanding what actually moves the outcome.
I work comfortably across both.


CFA LEVEL I | CERTIFIED FRM | SEMI-QUALIFIED CA
SERVICES
INVESTMENT RESEARCH: FROM EXECUTION TO JUDGEMENT
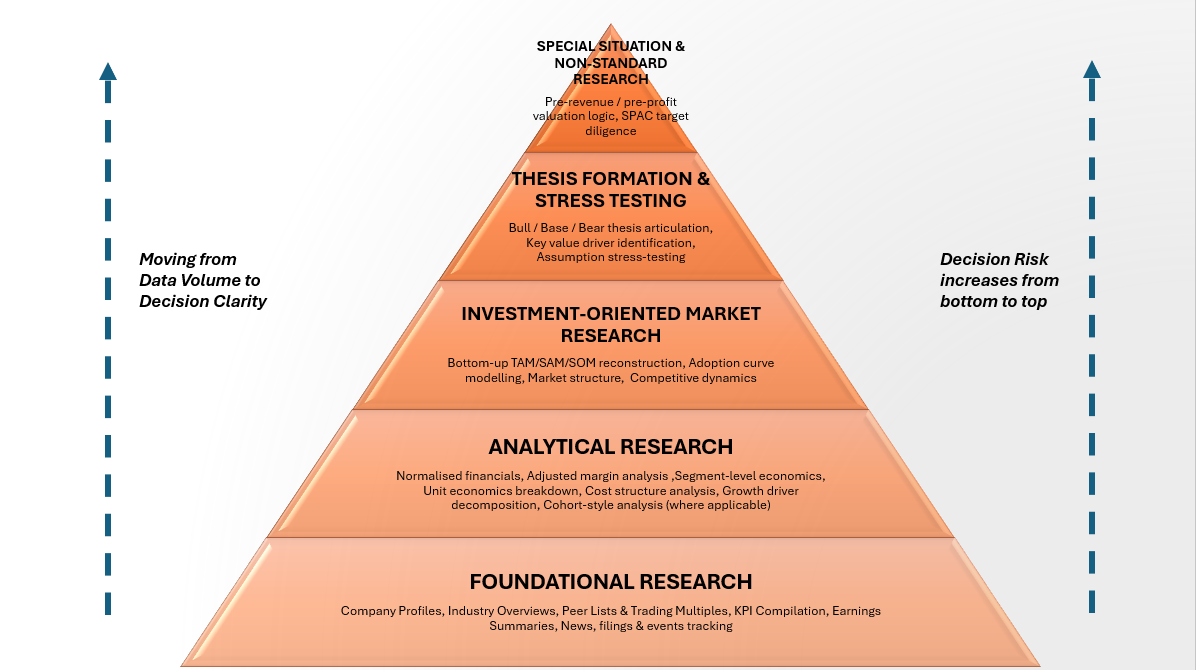
I’m a research-driven analyst focused on investment research, particularly in situations where data is incomplete & assumptions must be built, tested, or validated from first principles.
My work includes building bottom-up models for under-researched sectors, including healthcare diagnostics and niche biopharma, where assumptions are researched, structured, and tested rather than taken at face value.
I’ve worked extensively on SPAC-related projects, supporting analysis across multiple stages of the SPAC lifecycle. This includes founder share and earnout valuations, analysis of SPAC IPOs and extensions using SEC filings and authoring live deal summaries covering deal structures, PIPE funding etc.
Beyond analysis, I’ve helped build SOPs for consistent project execution, reducing errors and improving delivery quality while working closely with clients to ensure the work remained aligned with investment objectives.


CFA Level I | Certified FRM | Semi-qualified CA
ABOUT ME
I’m a research-driven analyst focused on investment research, particularly in situations where data is incomplete & assumptions must be built, tested, or validated from first principles.
My work includes building bottom-up models for under-researched sectors, including healthcare diagnostics and niche biopharma, where assumptions are researched, structured, and tested rather than taken at face value.
I’ve worked extensively on SPAC-related projects, supporting analysis across multiple stages of the SPAC lifecycle. This includes founder share and earnout valuations, analysis of SPAC IPOs and extensions using SEC filings and authoring live deal summaries covering deal structures, PIPE funding etc.
Beyond analysis, I’ve helped build SOPs for consistent project execution, reducing errors and improving delivery quality while working closely with clients to ensure the work remained aligned with investment objectives.
I'd love to chat.
Most conversations start with a single question rather than a fully-defined scope.
We can begin by clarifying the decision you’re trying to make, and whether my work would be helpful.
I typically respond within 1–2 business days.